Getting started with Titan Analytics
If you're using Titan Analytics to fill out your Fannie Mae 1004MC (Market Conditions Form), this document will get you up and running.
Document 3000 | Last updated: 08/10/2022 MJY
Follow the instructions below to process data exported from your MLS in Titan Analytics, and then export the calculations to your report:
Before using Titan Analytics in TOTAL, make sure you've downloaded and installed the most recent TOTAL update. Click here for instructions on getting the latest updates.
- Export the data from your MLS. Click here for MLS‑specific instructions.
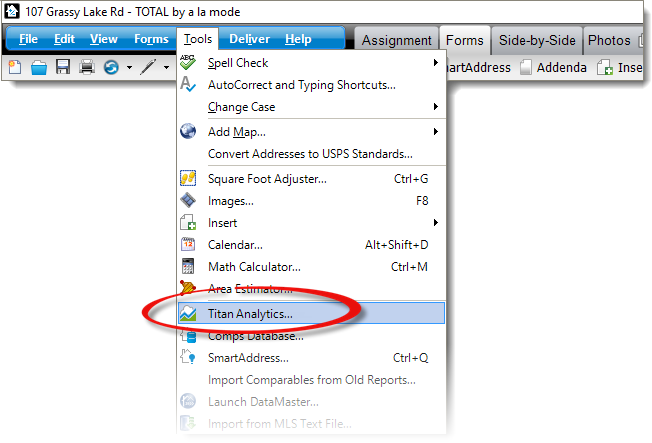
- Once you've saved your MLS export file, open your report, click Tools, and select Titan Analytics.
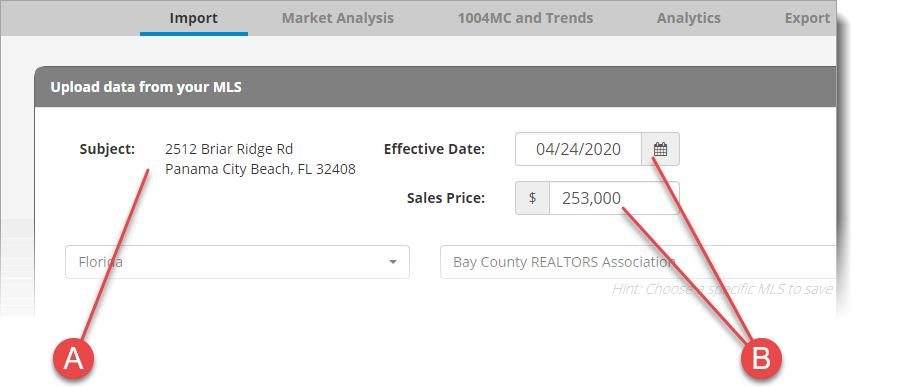
- Review the Subject details (A), and then enter the Effective Date and Sales Price (B) if necessary.
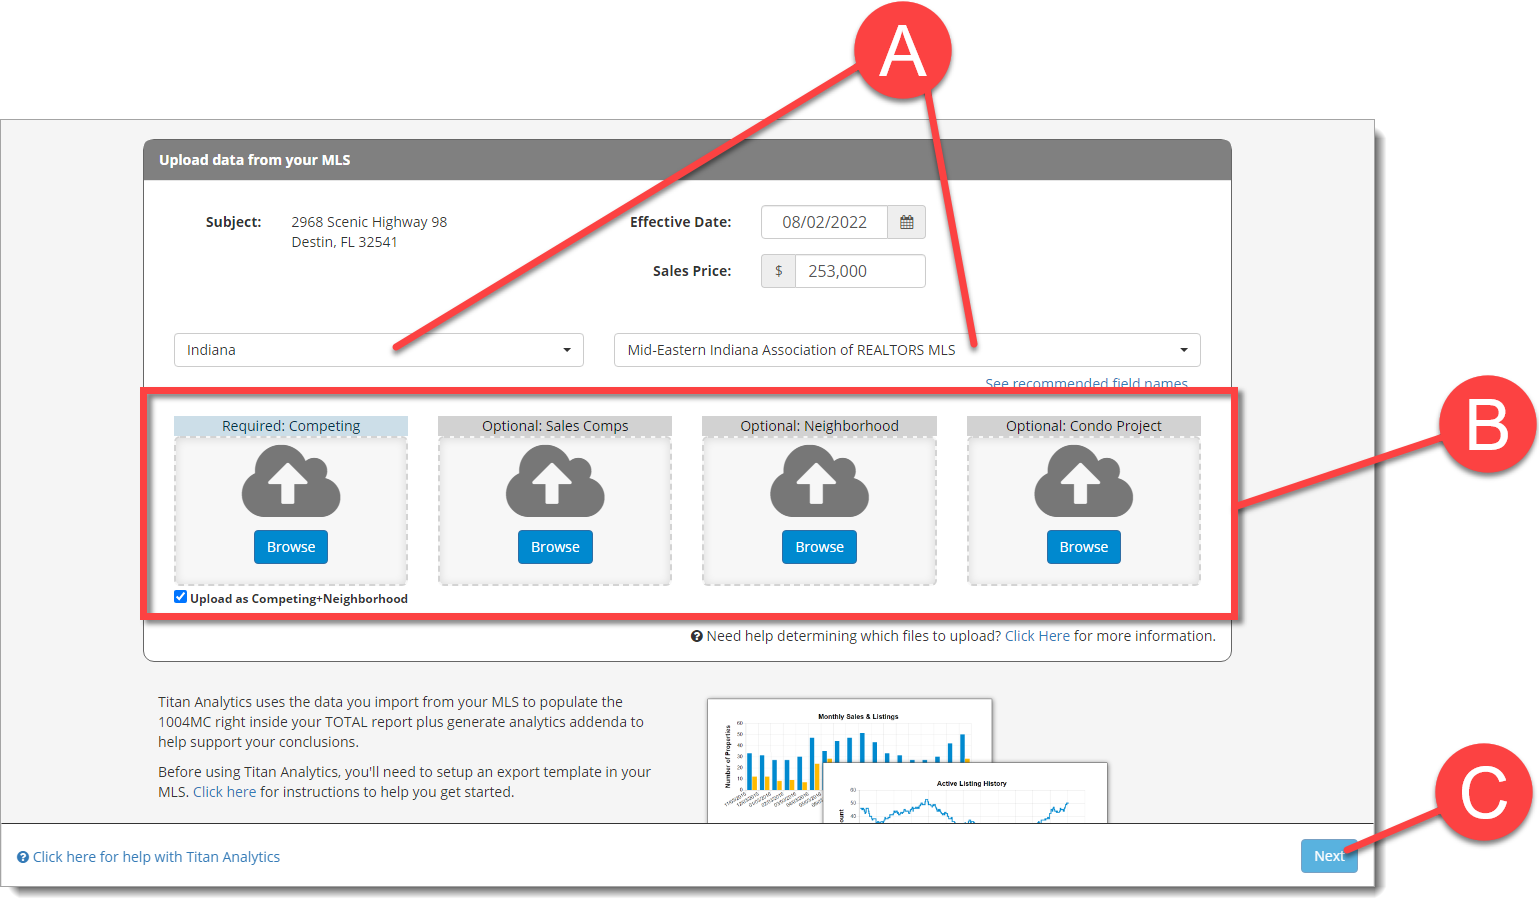
- Select your state and MLS board from the drop‑down menus (A). Then, drag and drop the CSV file(s) from your MLS, or click Browse to manually browse for a CSV file, select it, and then click Open (B). When you're finished, click Next (C).
Titan Analytics allows you to upload up to four files at once:
- Required: Competing
- A CSV of competing properties is required to complete the 1004MC form.
- If you want all of the properties in your CSV file to be marked as both Competing and Neighborhood, leave the Upload as Competing+Neighborhood checkbox checked.
- Optional: Sales Comps
- If you performed a separate search in your MLS just for your comps, upload them here. Titan Analtyics automatically marks them as comps on the next step.
- If you already have comp addresses entered into TOTAL, they're checked as comps on the next step. Or, you can manually check them off after importing a CSV.
- Optional: Neighborhood
- If you want Titan Analtyics to complete the One‑Unit Housing Trends section of your appraisal report, you must have properties marked as Neighborhood.
- If you performed a separate search in your MLS just for your neighborhood properties, upload them here. Or, check the Upload as Competing+Neighborhood box under Competing to mark all properties as both Competing and Neighborhood.
- Optional: Condo Project
- If your subject is a Condo, import all the Condo properties you exported from a separate MLS search here. This automatically marks the properties as Condos in the next step, and includes the Condo Analysis in your 1004MC.
- You can also mark properties as Condos manually in the next step.
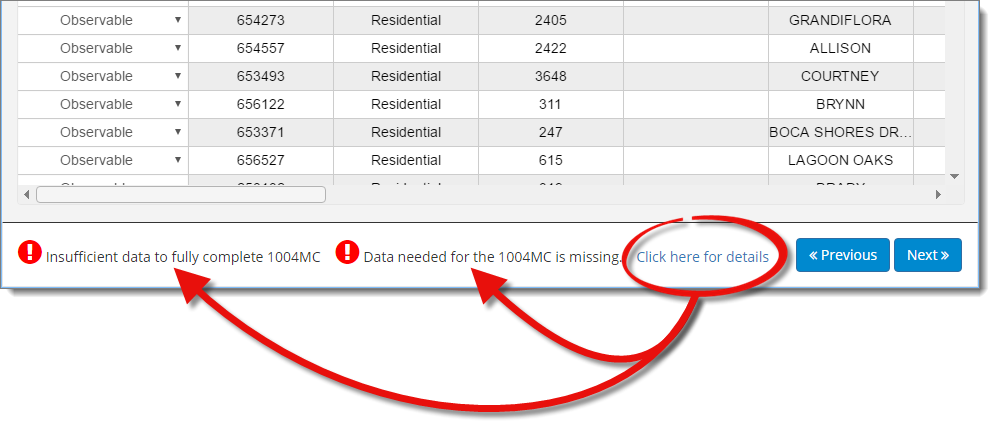
- Your properties are now shown on a map and listed in a grid. If Titan Analytics couldn't find one or more fields or determined it didn't have enough data to completely fill out the 1004MC, you'll see a warning at the bottom of the screen. Click the Click here for details link to view the missing or unmatched fields.
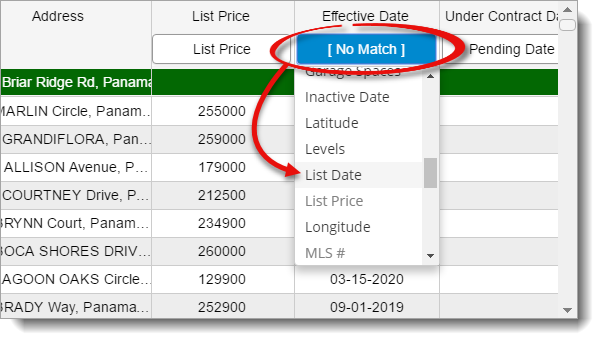
For example, if your MLS doesn't export a List Date but instead has an Effective Date, correct this by scrolling to the imported Effective Date column, clicking the dropdown, and selecting List Date. Once you do this, Titan Analytics will remember it from that point forward.
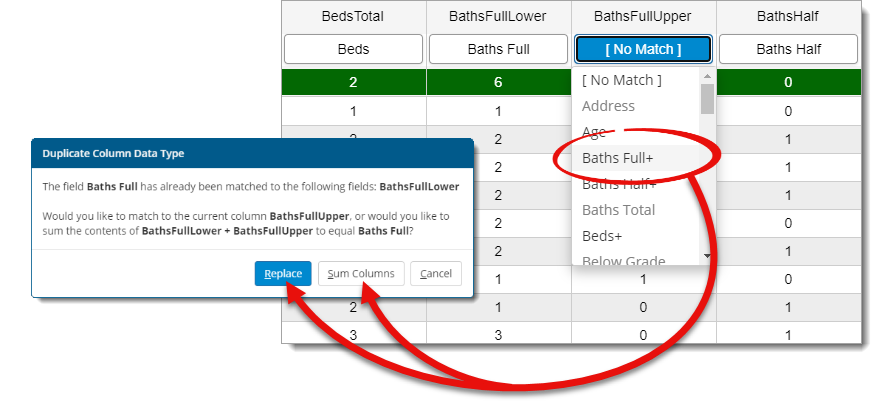
When matching field names with columns, a plus sign ( + ) appears next to field names that allow you to combine the contents of two or more columns. When you select a field name with a plus sign beside it, you're prompted to choose what action to take. Click Replace to remove the match from the original column and reassign it to the current column, or click Sum Columns to combine and sum the contents of any columns that have been matched with this field name.
- Once you've matched your fields, use this screen to identify outliers from your data export that you don't want to use in your 1004MC calculation. From here you can:
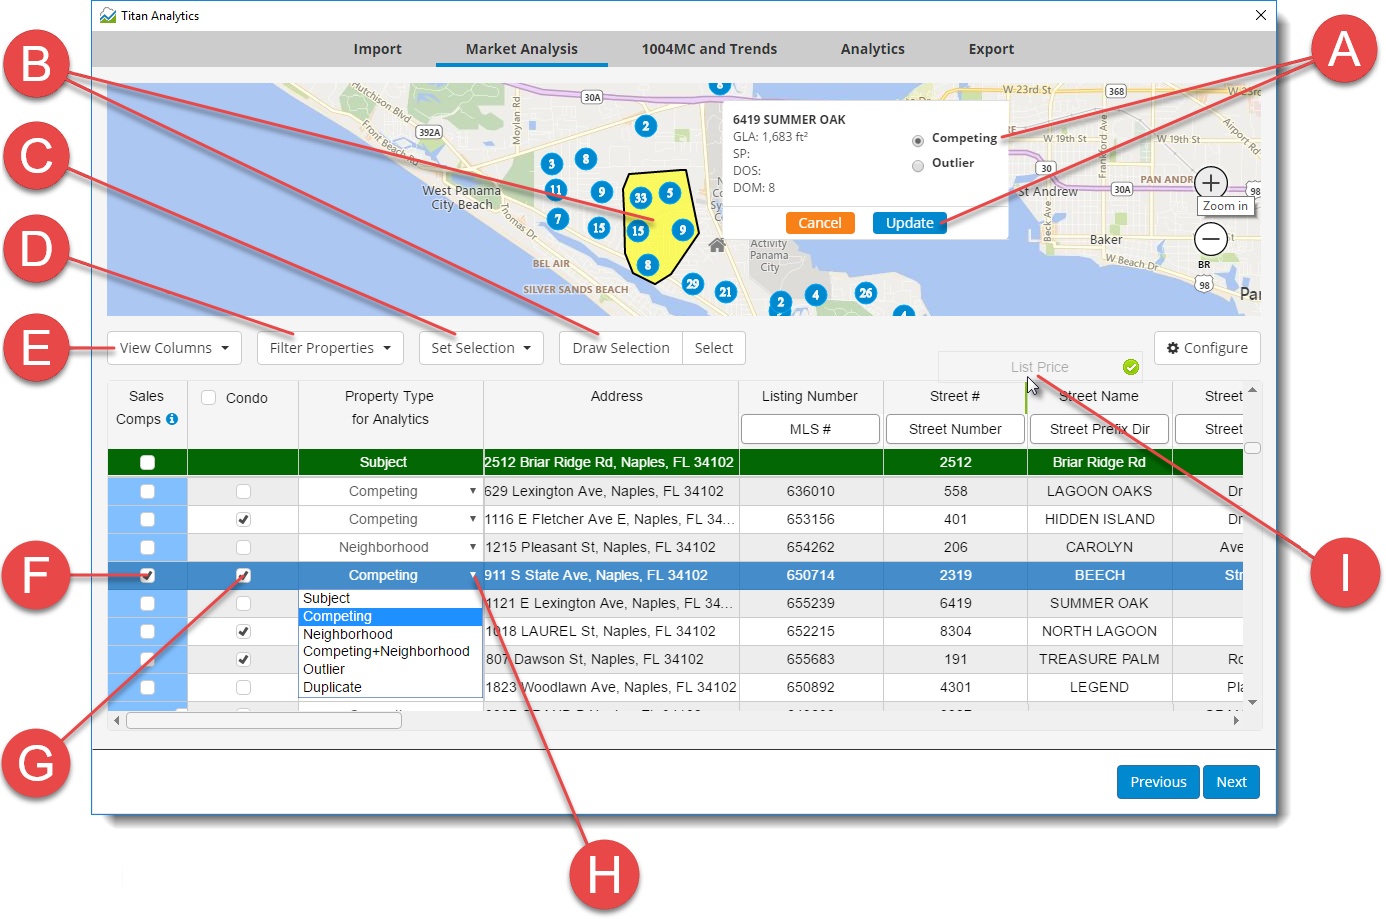
- Right‑click a property on the map to mark it as Competing or Outlier to include it in or remove it from calculations. Click Update to apply your changes.
- Click Draw Selection and then click the locations on the map image to plot the points around the perimeter of the area containing the properties you want to select. When you're finished plotting the points, right click to apply your selection. If you make changes to a property outside of the drawn area and you want to re‑select the properties in the drawn area, simply click Select.
- Place a check next to multiple properties, or draw an area and use the Set Selection drop‑down menu to mark all of the selected properties as Competing, Neighborhood, Competing+Neighborhood, Outlier, Duplicate, or Condo simultaneously.
- Use the Filter Properties drop‑down menu to choose whether you want to view properties marked as Competing, Neighborhood, Competing+Neighborhood, Outlier, Duplicate, or any combination therein.
- Use the View Columns drop‑down menu to show or hide specific columns.
- Place a check in the Sales Comps column beside each property you want to include in analytics. Any properties marked as Sales Comps are transferred back to the grid in the Side‑by‑Side PowerView.
- Place a check in the Condo column beside a property to indicate whether or not the property is part of the subject’s condominium project and should be considered for the condo portion of the 1004MC.
- Use the drop‑down menu in the Property Type for Analytics column to set a property as Competing, Neighborhood, Competing+Neighborhood, Outlier, Duplicate, or if it contains Subject data — to include it in or remove it from calculations. Marking a property as Subject will also fill in any missing data that wasn't automatically imported from your report in TOTAL or Titan Reports.
- Drag and drop column headers to rearrange them.
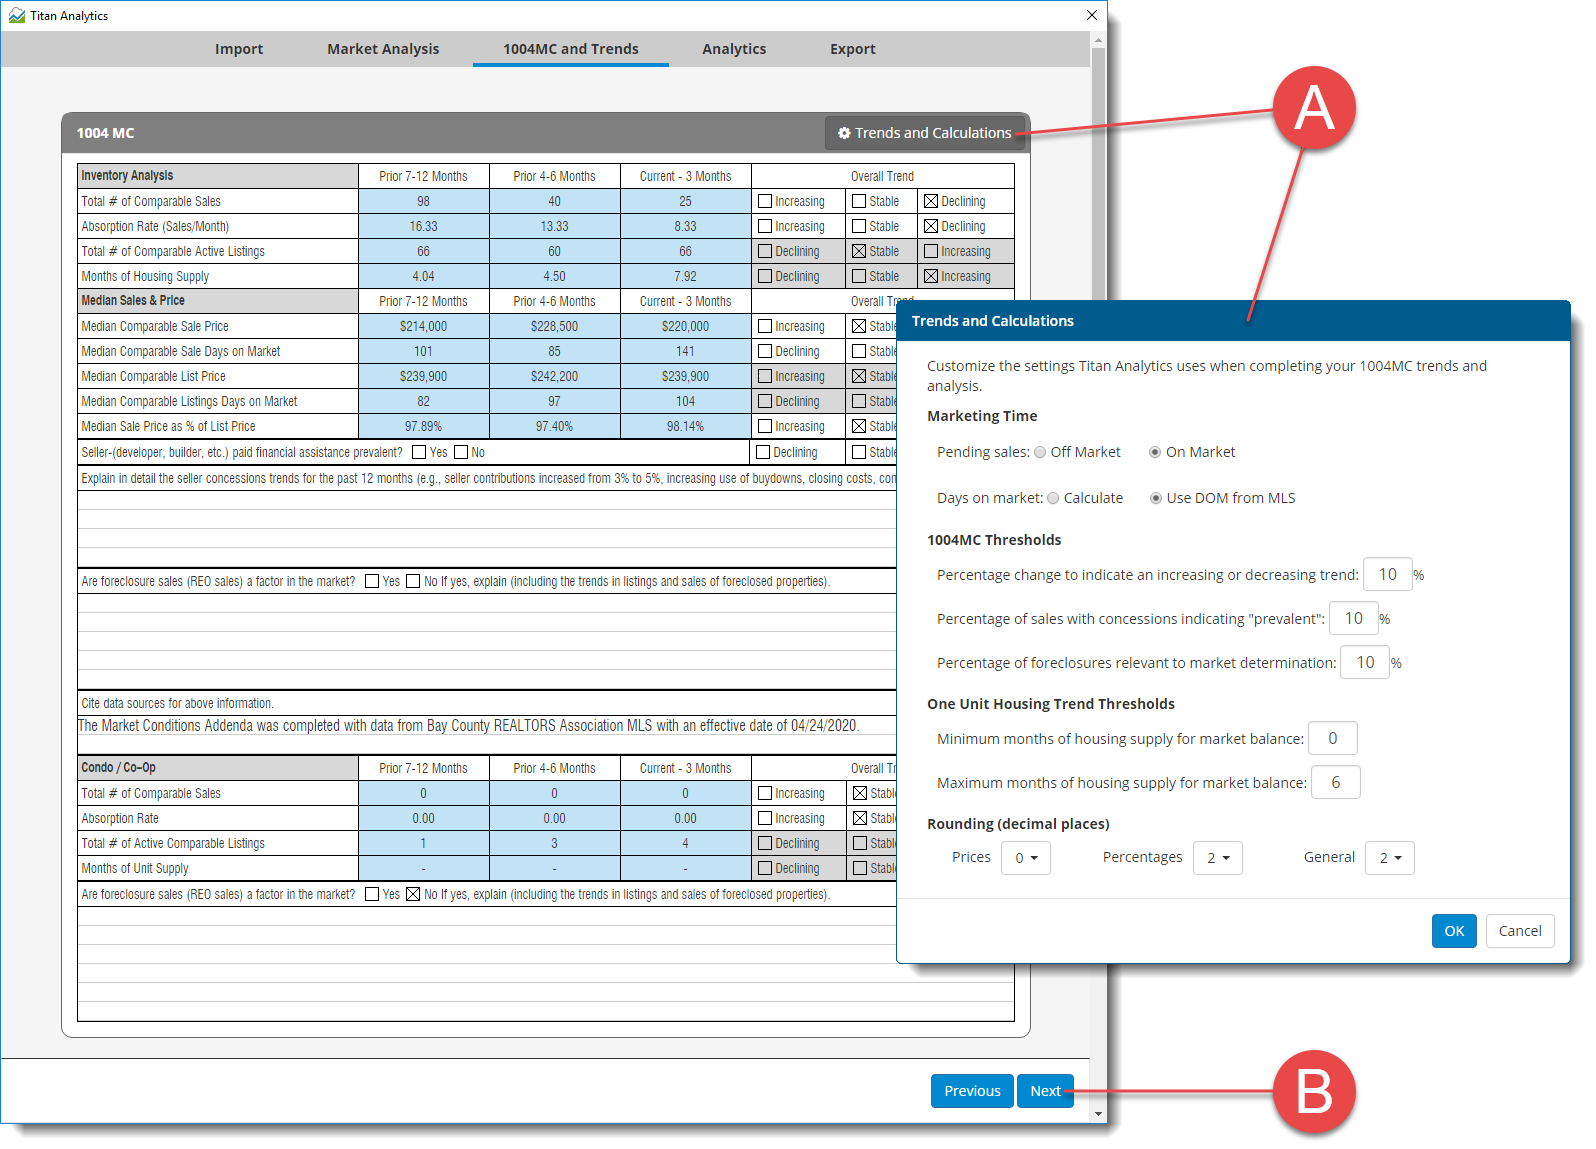
- Once you filter your properties, click Next to reach the 1004MC summary. This is the data that will be transferred back to your form. Click Trends and Calculations (A) to customize your settings, such as whether to consider Pending sales as On Market or Off Market. When you're finished reviewing your settings and data, click Next (B).
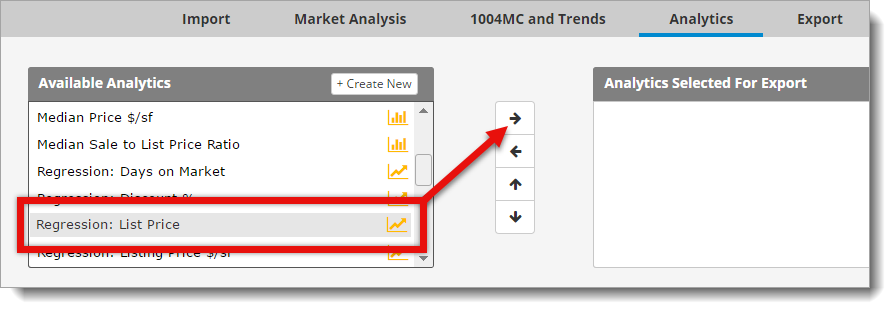
- Choose the graphs you want to add to the special Analytics Addendum page:
- Select a graph on the left and click the right arrow button to add it to your Analytics Addendum.
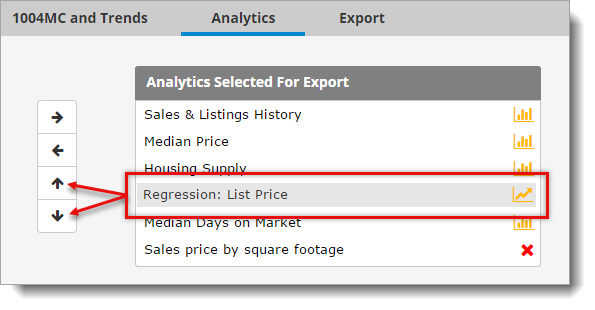
- Select a graph on the right and click the up and down arrows, or simply drag and drop graphs to rearrange them.
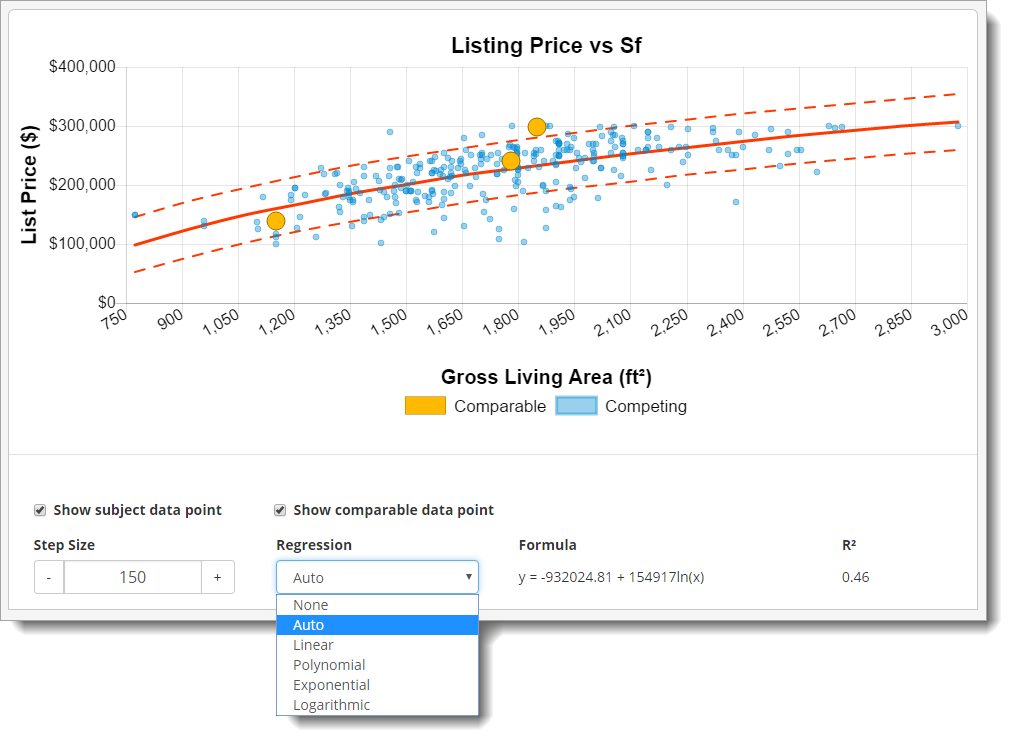
- If you added one of the regression graphs, adjust the parameters as needed.
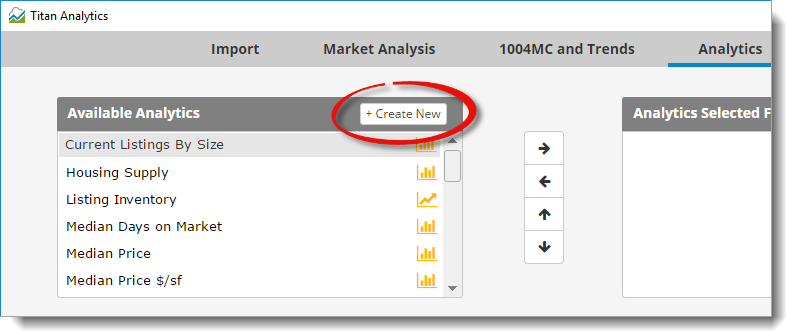
- Click + Create New at the top of the list of Available Analytics to create a custom chart or graph. Click here for instructions on creating your own charts and graphs.
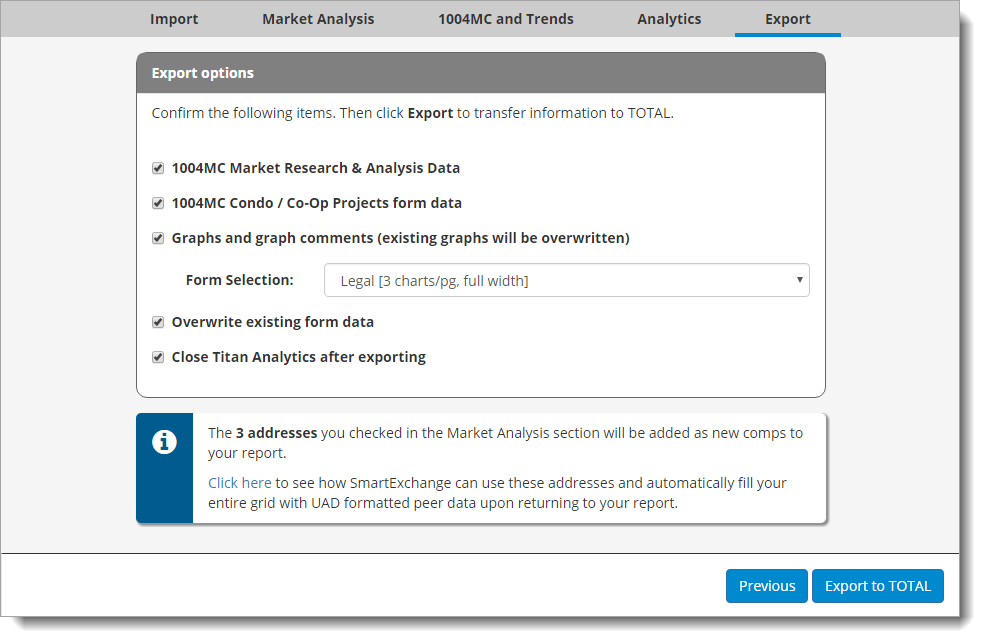
- Once you’ve chosen your graphs, click Next and choose your transfer options. Then, click Export to TOTAL or Export to Titan and Titan Analytics transfers your calculations and graphs to your report.
That's it! The 1004MC data and analysis are now included in your TOTAL report.
