How to create a custom chart or graph in Titan Analytics
This document explains how to create and customize your own charts and graphs in Titan Analytics.
Document 3009 | Last updated: 05/13/2020 MJY
- Go through your normal process to export data from your MLS and upload it to Titan Analytics. If you're new to Titan Analytics, or you need a refresher, click here for step‑by‑step instructions.
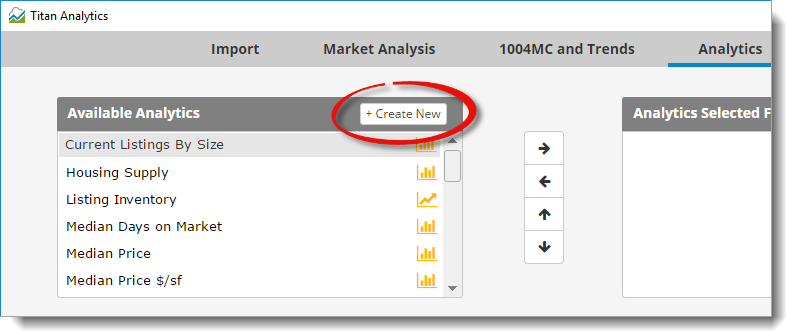
- Once you reach the Analytics section, click + Create New at the top of the list of Available Analytics.
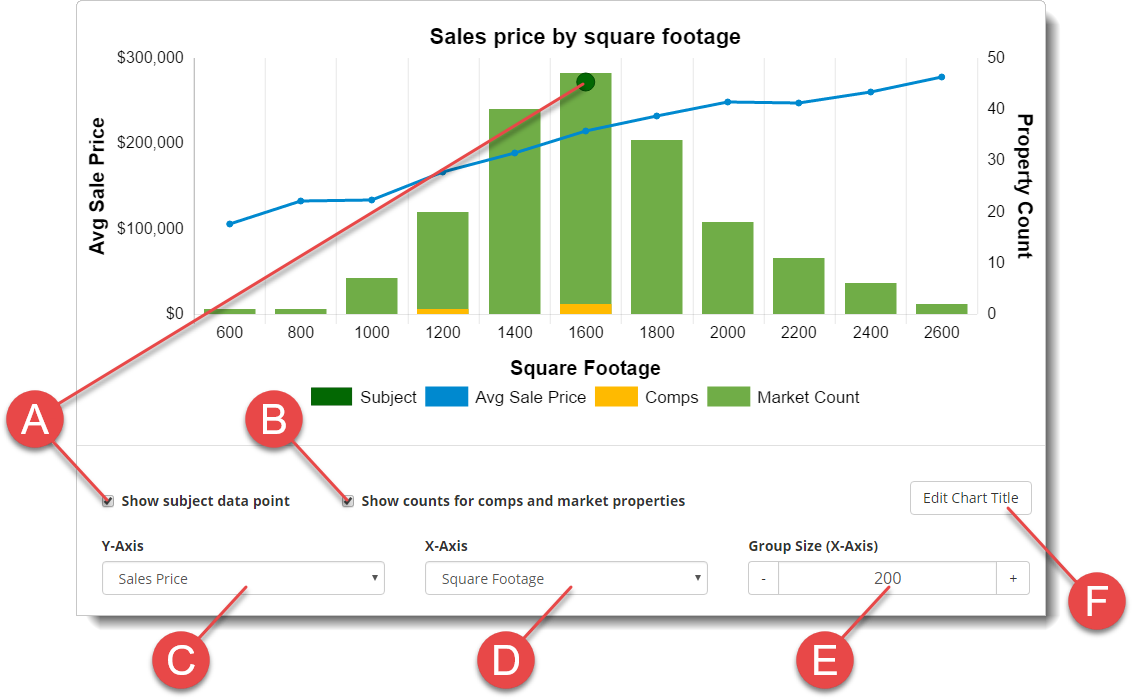
- Choose what data you want to include, and customize your chart as needed:
- Check this box to include a data point in your chart for the subject property.
- Check this box to show the number of comps and market properties that match each data point in a bar graph format. Leave this unchecked to display only the charted data points.
- Choose what data to include along the vertical Y‑Axis. Options include:
- Count Items
- Sale Price
- Sales $/sf.
- Choose what data to include along the horizontal X‑Axis. Options include:
- Age
- Bedrooms
- Below Grade Finished Area
- Garage Spaces
- Levels
- Sales Date
- Square Footage
- Total Baths
- Year Built
- When you choose Age, Below Grade Finished Area, Sales Date, Square Footage, or Year Built for the X‑Axis, an additional option is displayed to adjust the Group Size (X‑Axis):
- For numeric‑based data, enter the number by which you want to group, or use the plus and minus buttons to adjust the grouping incrementally.
- For date‑based data, choose whether you want to group your data by Weeks, Months, Quarters, or Years.
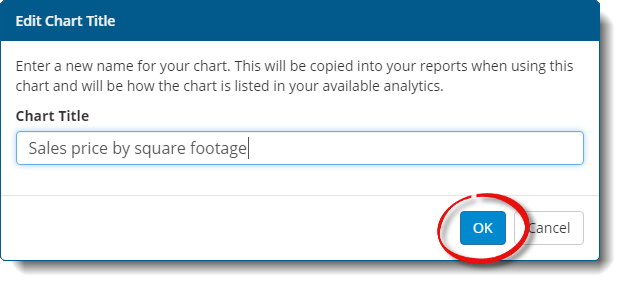
- Click Edit Chart Title to adjust the title of your custom chart. In the window that appears, enter the title as you want it to appear, and click OK.
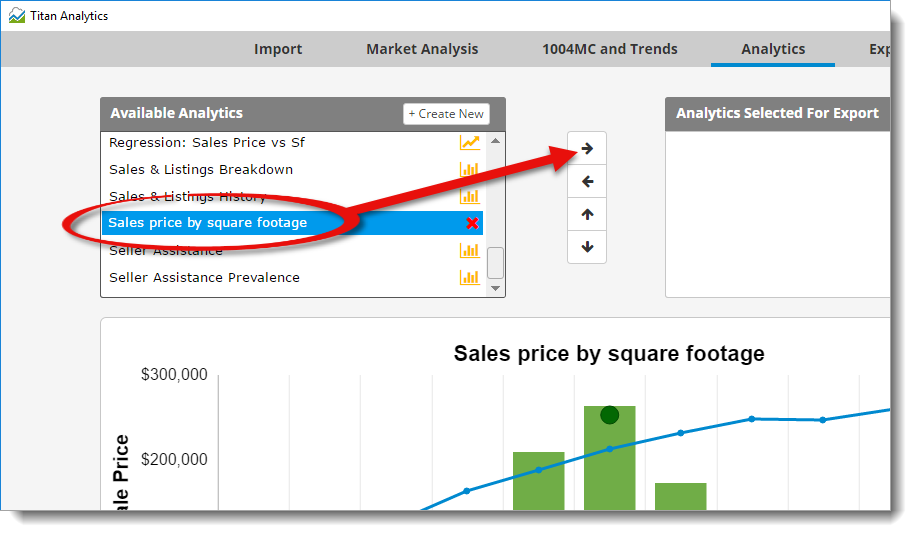
- When you're finished, scroll to the top, choose your custom chart from the list of Available Analytics, and click the right arrow ( ) to add it to the list of Analytics Selected For Export on the right.
To delete a custom chart you created, simply click the red X ( ) to the right of the chart title in the list of Available Analytics, and then click Delete to confirm that you want to permanently remove it.
- Add any additional charts or graphs you want to export to your report. Then, click Next to choose your export options and export everything to your report in TOTAL.


