How can I populate the One‑Unit Housing Trends section using Titan Analytics?
To make Titan Analytics fill out the One‑Unit Housing Trends section of your report, you can mark your CSV files as 'Neighborhood' and/or 'Competing'. This guide explains how.
Document 3006 | Last updated: 08/10/2022 MJY
The 1004MC is specific to competing properties. But on forms like the URAR, the neighborhood section is based on geographical boundaries — which may include more than just competing properties. So, by default, Titan Analytics doesn't complete the One‑Unit Housing Trends section of your report.
You can make Titan Analytics fill out this section too, though. There are two ways to do this, depending on your data:
- Method 1 — All properties in one CSV file
- Method 2 — Separate CSV files for competing and neighborhood properties
At this time, the graphs and charts in Titan Analytics only use properties labeled as competing.
Method 1: One CSV file
If your 1004MC data is the same as your neighborhood data, you can import a single CSV file, and label it as Competing+Neighborhood.
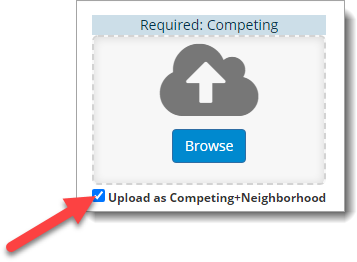
- From the Import step of Titan Analytics, drag and drop your CSV file into the Required: Competing upload area. Or, click Browse to manually browse for a CSV file, select it, and then click Open.
- Check the Upload as Competing+Neighborhood box below the Required: Competing upload area.
- That's it! Now, when you export your data to TOTAL, the One‑Unit Housing Trends section appears on your major form. The 1004MC and Trends step of Titan Analytics gives you a preview of the completed section.
 (A): This section uses properties that are marked as both Competing and Neighborhood.
(B): This section uses all properties marked as Neighborhood, regardless of whether or not they are also marked as Competing.
Method 2: Two CSV files
If your competing property data is a subset of the neighborhood, or has properties outside of the neighborhood boundaries, you need two CSV files from your MLS. One of them should contain search results for competing properties. The other should contain search results for the neighborhood.
When exporting the two CSV files from your MLS, be sure to use the same export template for both. Click here for help exporting CSV files.
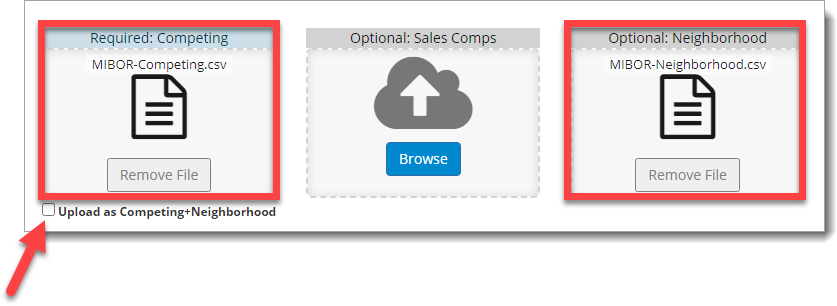
- On the Import step in Titan Analytics, drag and drop each of your MLS exports to the appropriate upload section for Competing and Neighborhood. Or, click Browse to manually browse for a CSV file, select it, and then click Open.
You must import both of your CSV files simultaneously with this method. During the import step, Titan Analytics determines where competing and neighborhood properties overlap, and uses only those overlapping properties to calculate your One‑Unit Housing trends.
- Make sure the Upload as Competing+Neighborhood box is not checked.
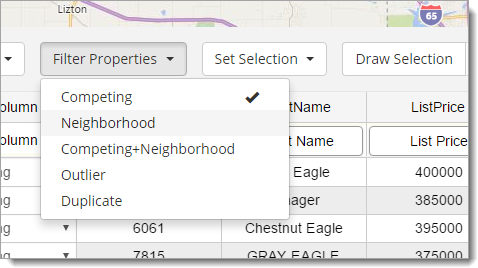
- Click Next to proceed to the Market Analysis screen. On this step, you can use the Filter Properties drop‑down to show your Competing properties and/or your Neighborhood properties.
- That's it! Now, when you export your data to TOTAL, the One‑Unit Housing Trends section appears on your major form. The 1004MC and Trends step of Titan Analytics gives you a preview of the completed section.
(A): This section uses properties that are marked as both Competing and Neighborhood.
(B): This section uses all properties marked as Neighborhood, regardless of whether or not they are also marked as Competing.