How to use Titan Analytics in TOTAL for Fannie Mae and Freddie Mac Market Analysis
This document explains how to perform Fannie Mae and Freddie Mac Market Analysis using Titan Analytics in TOTAL
Document 3010 | Last updated: 02/06/2025 MJY

Check out the video above, and follow the instructions below to learn how to use market data from your MLS in conjunction with Titan Analytics to conduct a Fannie Mae and Freddie Mac market analysis:
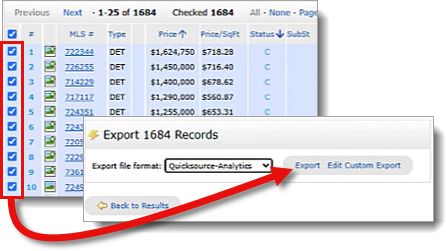
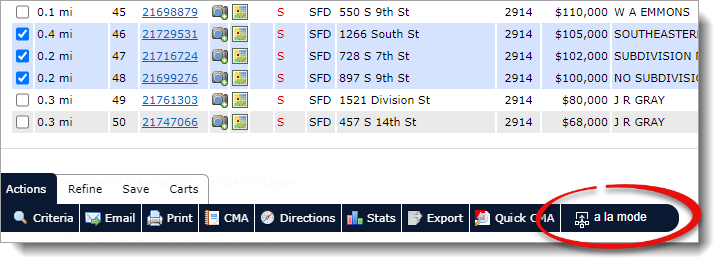
- Export your market data from your MLS. Use your MLS website to define the market by choosing cities, neighborhoods, property types, and any other criteria you want to set. Select the properties you want to include, and then export and download the file to your computer.
- Open your report in TOTAL and make note of the Date of Sale/Time fields for your comparables. You'll need those dates once you're in Titan Analytics.
- Next, launch Titan Analytics, click Browse to locate and upload the market data file you just downloaded from your MLS website, make sure you've entered an Effective Date, and click Next. Then, click through Market Analysis and the 1004 MC and Trends sections as usual.

- When you reach the charts and graphs in the Analytics section, click + Create New at the top of the Available Analytics on the left. Then, click the arrow pointing to the right ( ) to add it to the Analytics Selected For Export on the right.

- At the bottom of the page, uncheck the boxes next to Show subject… and Show Counts…. Then, set the Y‑Axis to Sales Price, set the X‑Axis to Sales Date, and change the Group Size (X‑Axis) to Months.
 You can also choose Weeks for the Group Size, but there's often too much variability in certain markets from week to week. Choose the option that best suits your needs.
 - Next, click Edit Chart Title, update the title to something easily identifiable — such as Market Analysis Monthly ‑ Sale Price, and click OK.

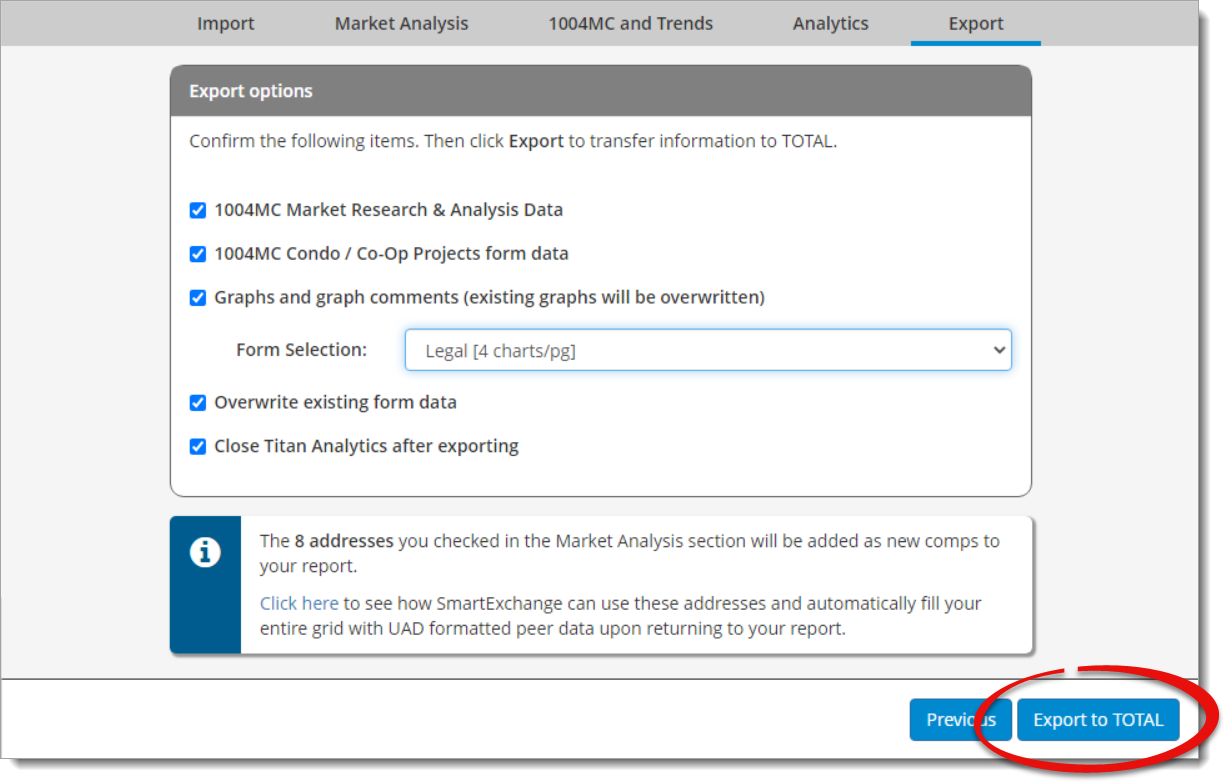
If all you're wanting to do is add this chart to your report, simply click Next, adjust your Export options, and click Export to TOTAL.
If you're wanting to extract percentages for the comps grid, continue reading below for more information.
Extracting percentages
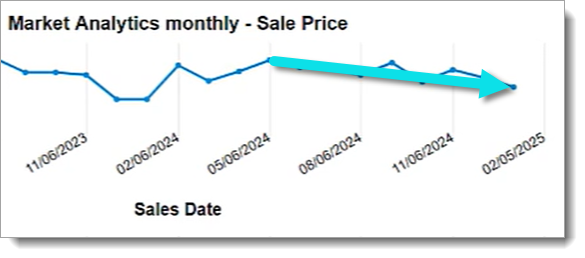
When extracting percentages, note any variability in the last year's data to justify time adjustments for each comp. Notice the variability present in the example below:

If we're using a comp from a year ago, we could justify an upward adjustment for that sale date:

If we're using a comp from May, we might consider adjusting downward for that timeframe:
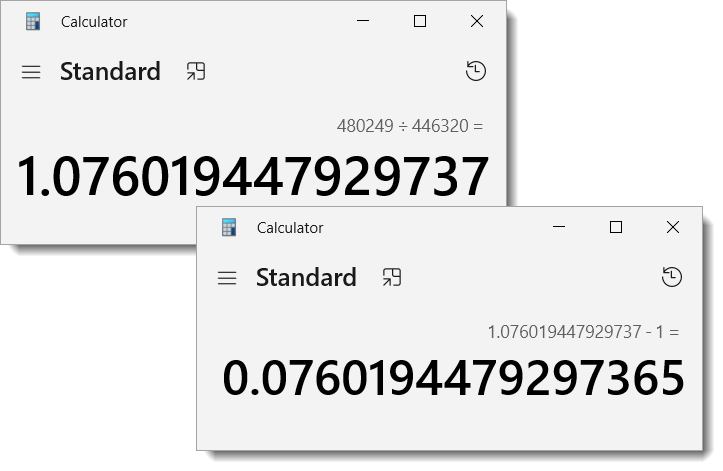
To get the percentage, hover over the effective date, and then hover over the date of your comp sale on your chart to get the average sale prices for those dates.
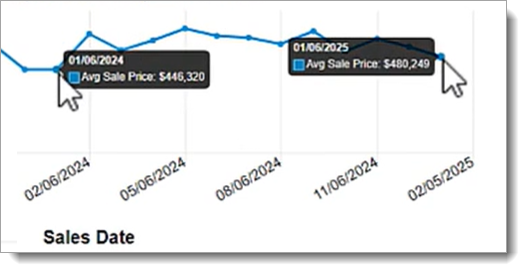
Then, take the average sale price on your effective date, divide it by the average sale price in the month of your comp sale, and subtract by one. In our example, we'd take $480,249, divide it by$446,320, and subtract by 1 to get 7.6%.
Write down this number and repeat for other dates. A positive number indicates an upward adjustment while a negative number indicates a downward adjustment.
Once you've noted the adjustment percentages for your comps, click Next, adjust your Export options, and click Export to TOTAL.
When you're back in TOTAL, add each calculated percentage to the appropriate comp. Check your chart and add any necessary analysis, and comment about the comp adjustments after reading up on the GSE policy and the seller's guide.