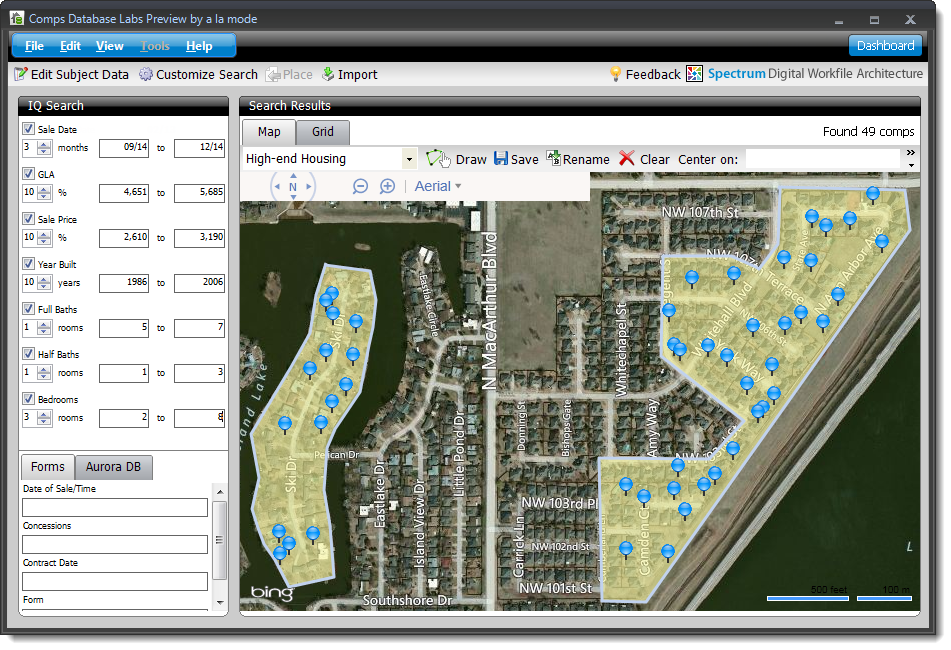
It’s often easier to spot valid comps when you see them laid out on a map.
New to TOTAL is the Comps Database Map view where all of your
available comps are displayed after being filtered using Search IQ and the
Filter tabs.
While the Map view by itself is extremely helpful in
determining appropriate comps for your report, there are a number of other tools
available in TOTAL's Comps database that help you narrow your results and choose
the best comps for your report.
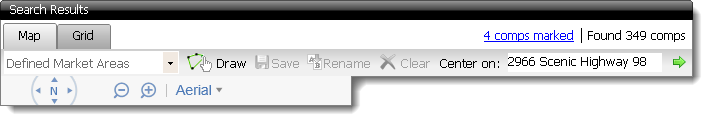
- Defined
Market Areas drop‑down menu - The Defined Market Areas
drop‑down menu lists all market areas that have been drawn on your map and
saved. If this is your first time in the comps database, or if you have not
drawn a market area yet this drop‑down menu will be empty. Click here for information on drawing and creating
market areas. Once created, your market areas can be saved so that they
are available for future use in the Market Areas drop‑down menu.
- Draw - Allows you to draw
a Market Area on your map. Click here to jump to
the section about drawing market areas.
- Save - Allows you to save
a Market Area you've drawn.
- Rename - Allows you to
rename an existing area.
- Clear - This clears any
market area currently on the map. If you have not saved your market area,
clicking this clears what you have drawn and allows you to start over.
- Center on: - Allows you to
center on a specific location. You can enter a specific address, zip code,
city, or any piece of information recognized by Google Maps.
- Pan - Allows you to pan
the map North, south, east or west. Alternatively, you can also click and drag
the map to reposition it.
- Zoom In/Zoom Out - Allows
you to zoom in or out on the map image.
- Map Type - Allows you to
select the type of map image. Choose from Road,
Aerial, or Automatic. Automatic determines
the type of map image to be used based on the current zoom level.
To help you further refine your results, TOTAL's Map view
allows you to draw market areas on your map. The property types in the area that
you appraise can change dramatically by simply crossing the street, so the
ability to plot out these areas on a map provides you the precision needed to
narrow down and pin point the exact properties needed for your current report.
Follow the instructions below to draw a market area:
- Click Draw in your map tools.
- After clicking Draw, your mouse cursor changes to a pen icon when you move
it over the map image. Click the locations on the map image to plot the points
around the perimeter of your market area.
- If you make a mistake while plotting the market area, click
Clear in your map tools at any time to clear your market area
and start over.
- When you move your mouse cursor to the last point to close the area, the
perimeter of the area is highlighted in red to clearly display the area's
boundaries. When it is red, click to plot the last point and close the area.
- At this point, enter a name for your market in the Defined Market Areas dropdown. When you close
an area, the area name appears as "Untitled" by default. Clear this text and
enter the name or description for your market area, then click
Save to save your market area.
New areas can be added to an existing market area at any time. Say, for
example, you drew your first area to separate higher-end housing from mid-level
or moderate housing, but 2 blocks over, a new housing development has begun that
also has higher-end housing. Simply select your market area from the Defined Market Areas dropdown, click
Draw, and draw the perimeter of the new housing development.
When you're finished, click Save and the new area is added to
the existing area so that both areas appear when this market is selected.
If you need to change the name of the Market Area after saving it, click
Rename in the map tools.
To start a new market area after viewing an existing market or creating a new
one, click Clear to wipe the market areas from the map image,
then click Draw to draw the new area
following the steps above.
The location of Properties are indicated by blue and red pushpin icons. A red
icon (  ) indicates the location of your
subject property, whereas blue pushpin icons (
) indicates the location of your
subject property, whereas blue pushpin icons (  ) indicate the placement
of the properties in your comps database.
) indicate the placement
of the properties in your comps database.
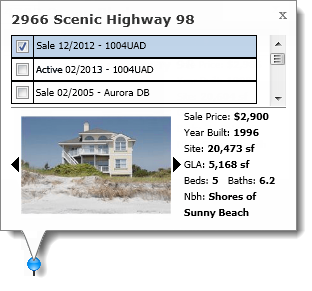
When you launch the Comps Database, the map centers on your subject property
and displays the subject's information in a Property Information Balloon. The
Property Information Balloon shows a few different items:
- The address of the selected property appears at the top of the balloon.
- Below the address, the data source and history of the
property is displayed. Each time the comparable is used in a new report and is
imported into the database, TOTAL stores the sale history of the property, the
date, and the source of the information. The status is listed as a sale,
active, pending, or whatever was entered for the property when it was
imported. Beside the sale history is the date it was imported, followed by
it's source. The available sources are currently limited to Zap files, and
Aurora's Comps Database, so the sources displayed will show either the form
that was used in the ZAP file, or it displays the source as Aurora
DB. In future updates, the import sources will be expanded, so you
may see sources such as your local MLS, a CSV file, NDC Data, or other import
sources. Stay tuned for more information.
- On the lower left, any images associated with the property when imported
are displayed. If more than 1 image is available, click the black arrows to
the left or right to view additional images.
- On the lower right of the balloon are 6 key pieces of information about
the property including the List Price, Year Built, Site Size, GLA, Number of
Bedrooms, Number of Baths, and the Neighborhood Description (nbh is only
available for comps that have neighborhood information entered and are
imported from TOTAL).

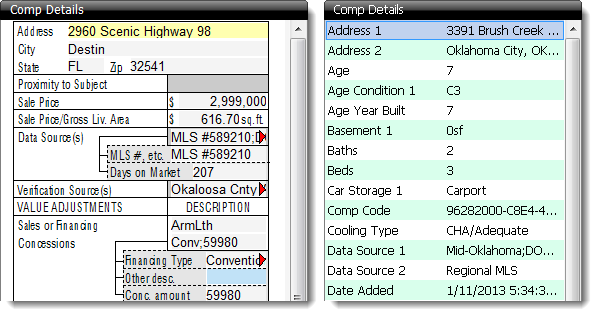
When you select a property on the map, it displays the basic information in
the Property Information Balloon, but it also displays all available information
about the property in the Comp Details Panel on the right.
Depending on the source of the property data, the available information is
displayed on a form layout (if a form is detected in the source data), or it is
displayed on a generic grid with each available field listed. The data for the
property can be edited here on the fly, and any changes are saved automatically
as soon as you leave the field.
To mark a comparable to be placed in your report from the
Map view:
- Select the property icon
on the map to view the Property
Information Balloon.
- In the Property Information Balloon, select the data source to use by checking the box beside it.
- Continue selecting properties on the map and marking the data source to
use in the Property Information Balloons.
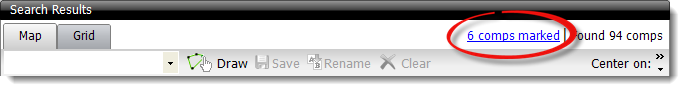
- As you mark comps to be placed in your report, they are tracked and
indicated above the map image on the upper right.
- To view the comps currently marked, click the Comps
Marked button.
- To remove a comp from the list of comps to be placed, uncheck the box in
the Property Information Balloon, or uncheck them in the Marked Comps
window.
- Once you have selected the comps you want to use, Click
Place in the Marked Comps window, or from the Comps Database
toolbar to place them in your report.
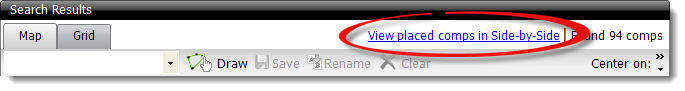
After placing the comps in your report, the Comps Database window remains
open, and the Marked Comps button that was present previously changes so that it
now displays View placed comps in Side‑by‑Side. Click
View placed comps in Side‑by‑Side to jump to them in the Side‑by‑Side PowerView.